
INTRADAY ACCUMULATION GAME
NEVER WHAT YOU THINK IT WOULD LOOK LIKE...

Accumulation and distribution are always happening in the market as participants continuously exchange positions. The real challenge is identifying which variables can signal whether the market is currently in an accumulation phase or a distribution phase. In hindsight, this often looks obvious, but finding factors that provide an edge in real time is much more difficult.
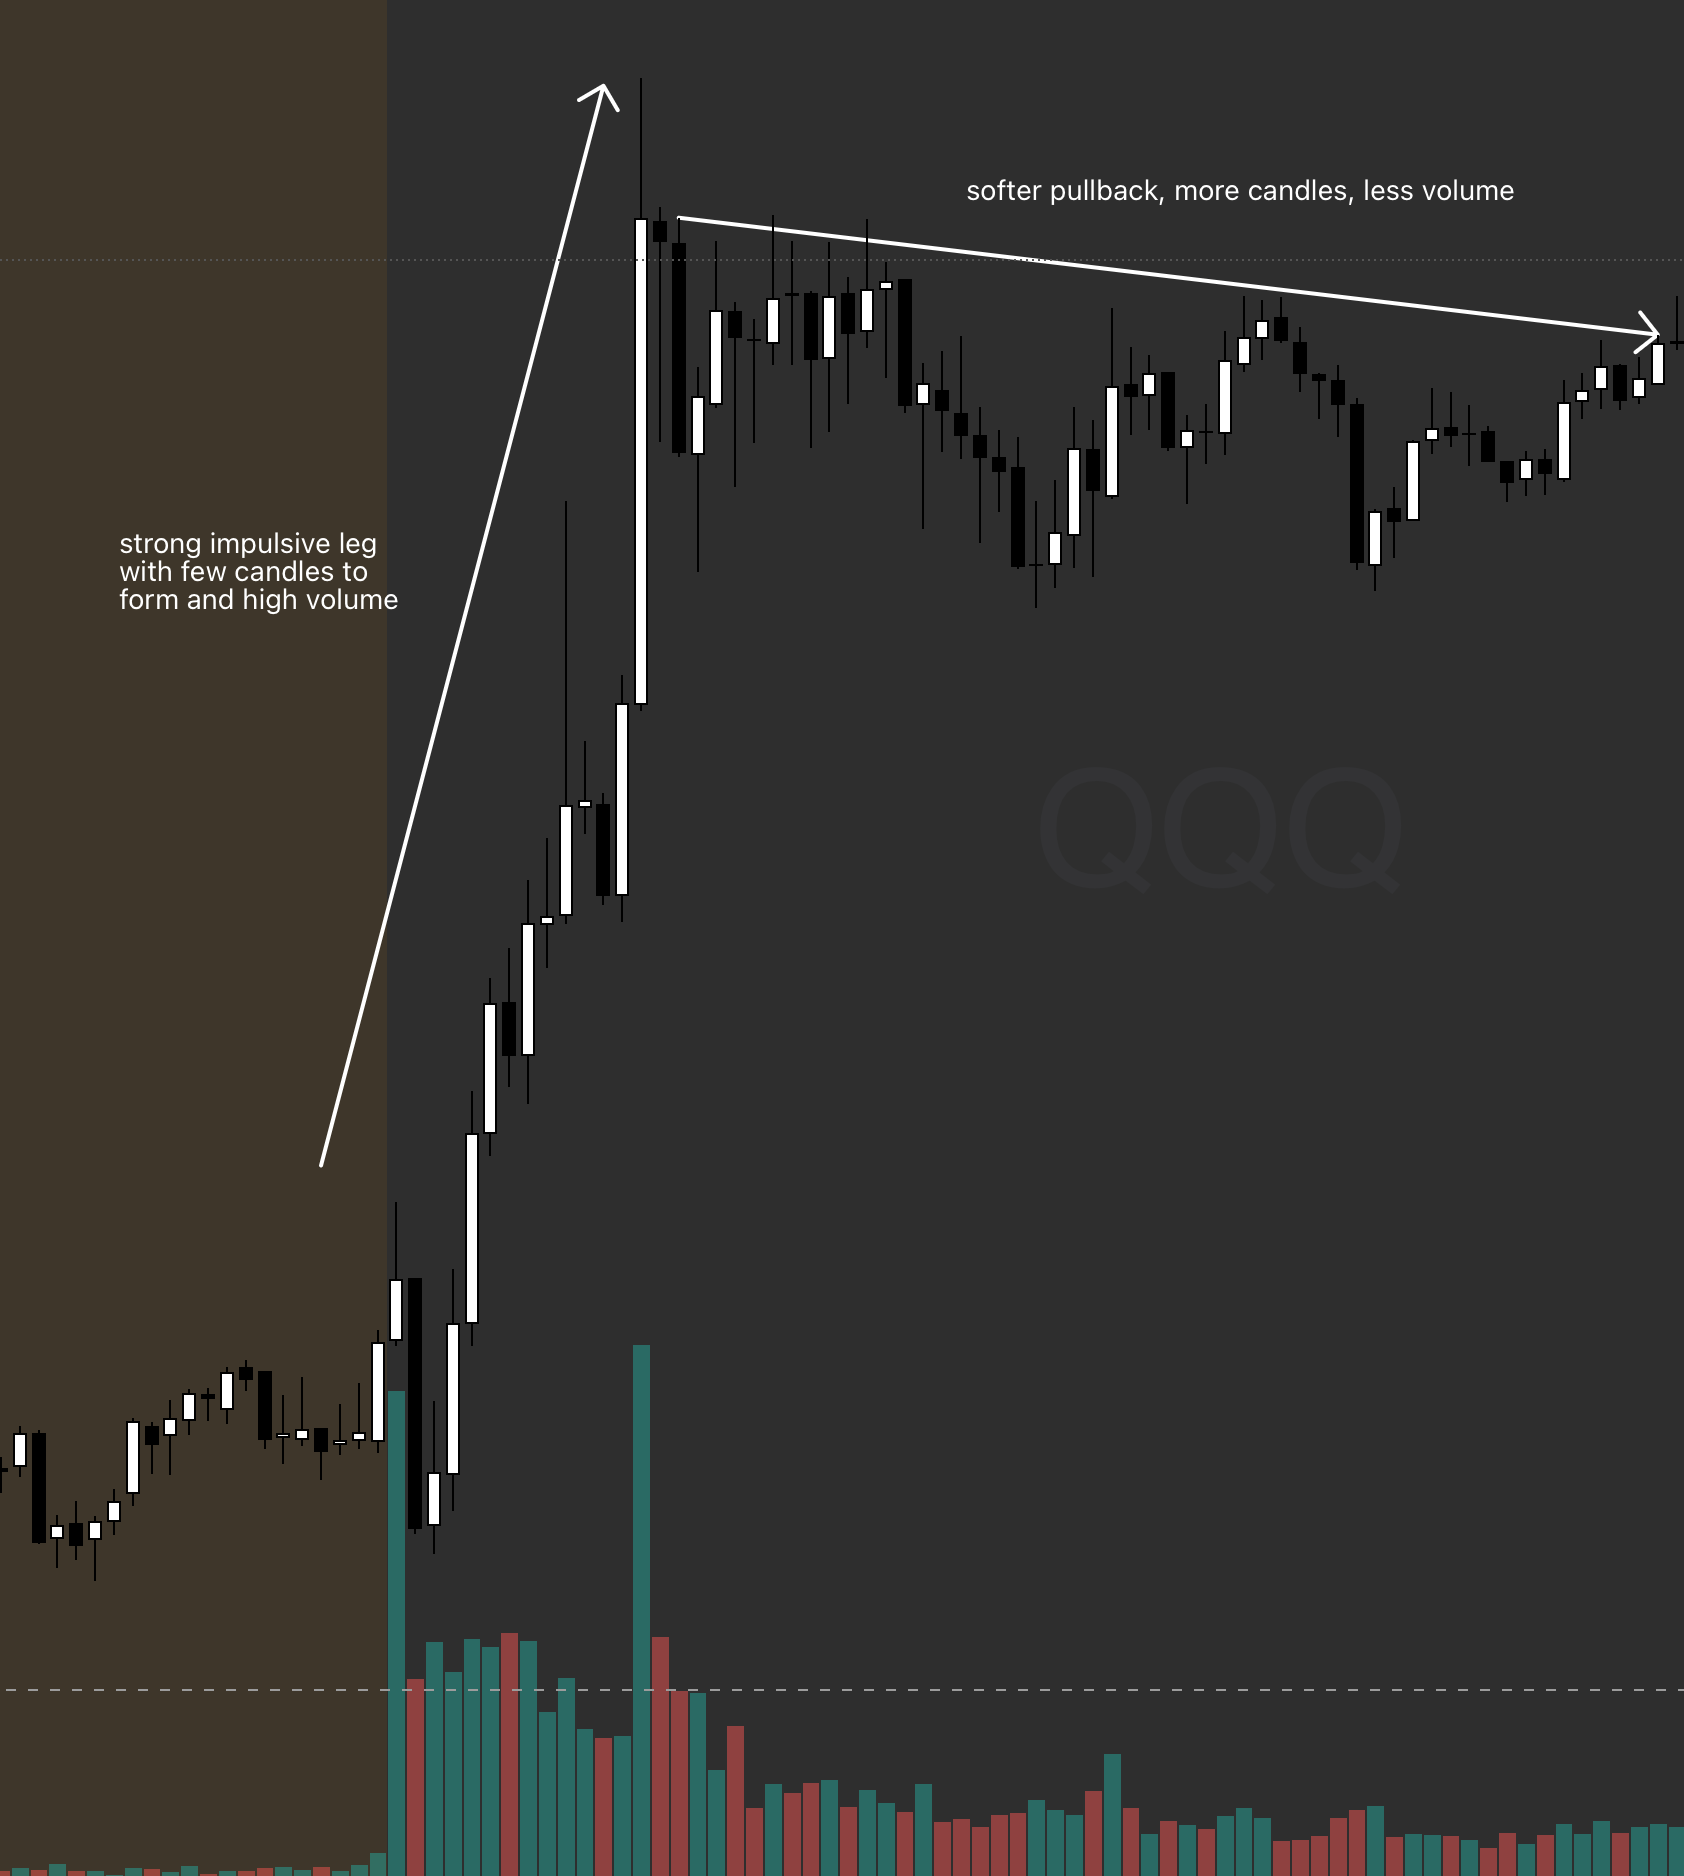
In this framework, the term pullback refers to the accumulation portion of price action that follows an initial impulsive bullish move. The exact size of that impulsive move matters less than its quality. What matters most is how strong the move was, including how few candles it took to form, how sharply volatility expanded, and how much volume was traded during the impulsive leg.
The first thing to define within a pullback leg is context, since that is the most important element. A pullback cannot really exist without context, because price must be pulling back from something meaningful. Before a valid pullback can form, the market must first produce a strong impulsive bullish leg. That bullish move should be faster and more forceful than the pullback that follows, which can be measured by candle count and the distance traveled in pips, points, or cents. For an accumulation setup to be valid, a strong bullish impulse should then be followed by a weaker, softer pullback that develops in a more consolidated structure.
Conceptual example showing a strong impulsive bullish leg followed by a softer pullback leg, presented in a simplified way from a higher time frame with fewer candles for clearer visualization:
Summary of the key variables for trading accumulation or distribution pullback structures:
Market presence: These patterns appear across all markets, from low-priced penny stocks to highly liquid instruments like SPX, BTC and FOREX. Accumulation and distribution behavior is universal and can be found in virtually any traded asset.
Research process using historical charts: Traders should focus on identifying a clear impulsive bullish move or uptrend for accumulation setups, or a clear impulsive bearish move or downtrend for distribution setups. The emphasis should be on clean, directional moves rather than just any trend. An impulsive trend should move strongly in one direction with only minor pullbacks along the way. This helps filter out weaker opportunities and makes pattern recognition more efficient. In the pullback leg, price should form progressively lower highs and begin to contract toward the right side of the chart. These are the main conditions to look for when studying historical examples. Developing the ability to recognize these setups in real time takes extensive screen time, so practicing on historical charts first is essential.
Advantages: These are common patterns that occur in all markets, which makes them widely applicable.
Disadvantages: This is not a high-edge setup on its own, so the alpha is limited. It requires very disciplined stop loss management, otherwise it can become unprofitable. It can also be difficult for less experienced traders to determine which highs and lows in the structure are the important ones to monitor for accumulation confirmation. This skill takes significant practice and cannot be developed simply by reading about it.
Below is the conceptual presentation of pullback leg after impulse move, followed by rotation and further upward thrust, in stages:
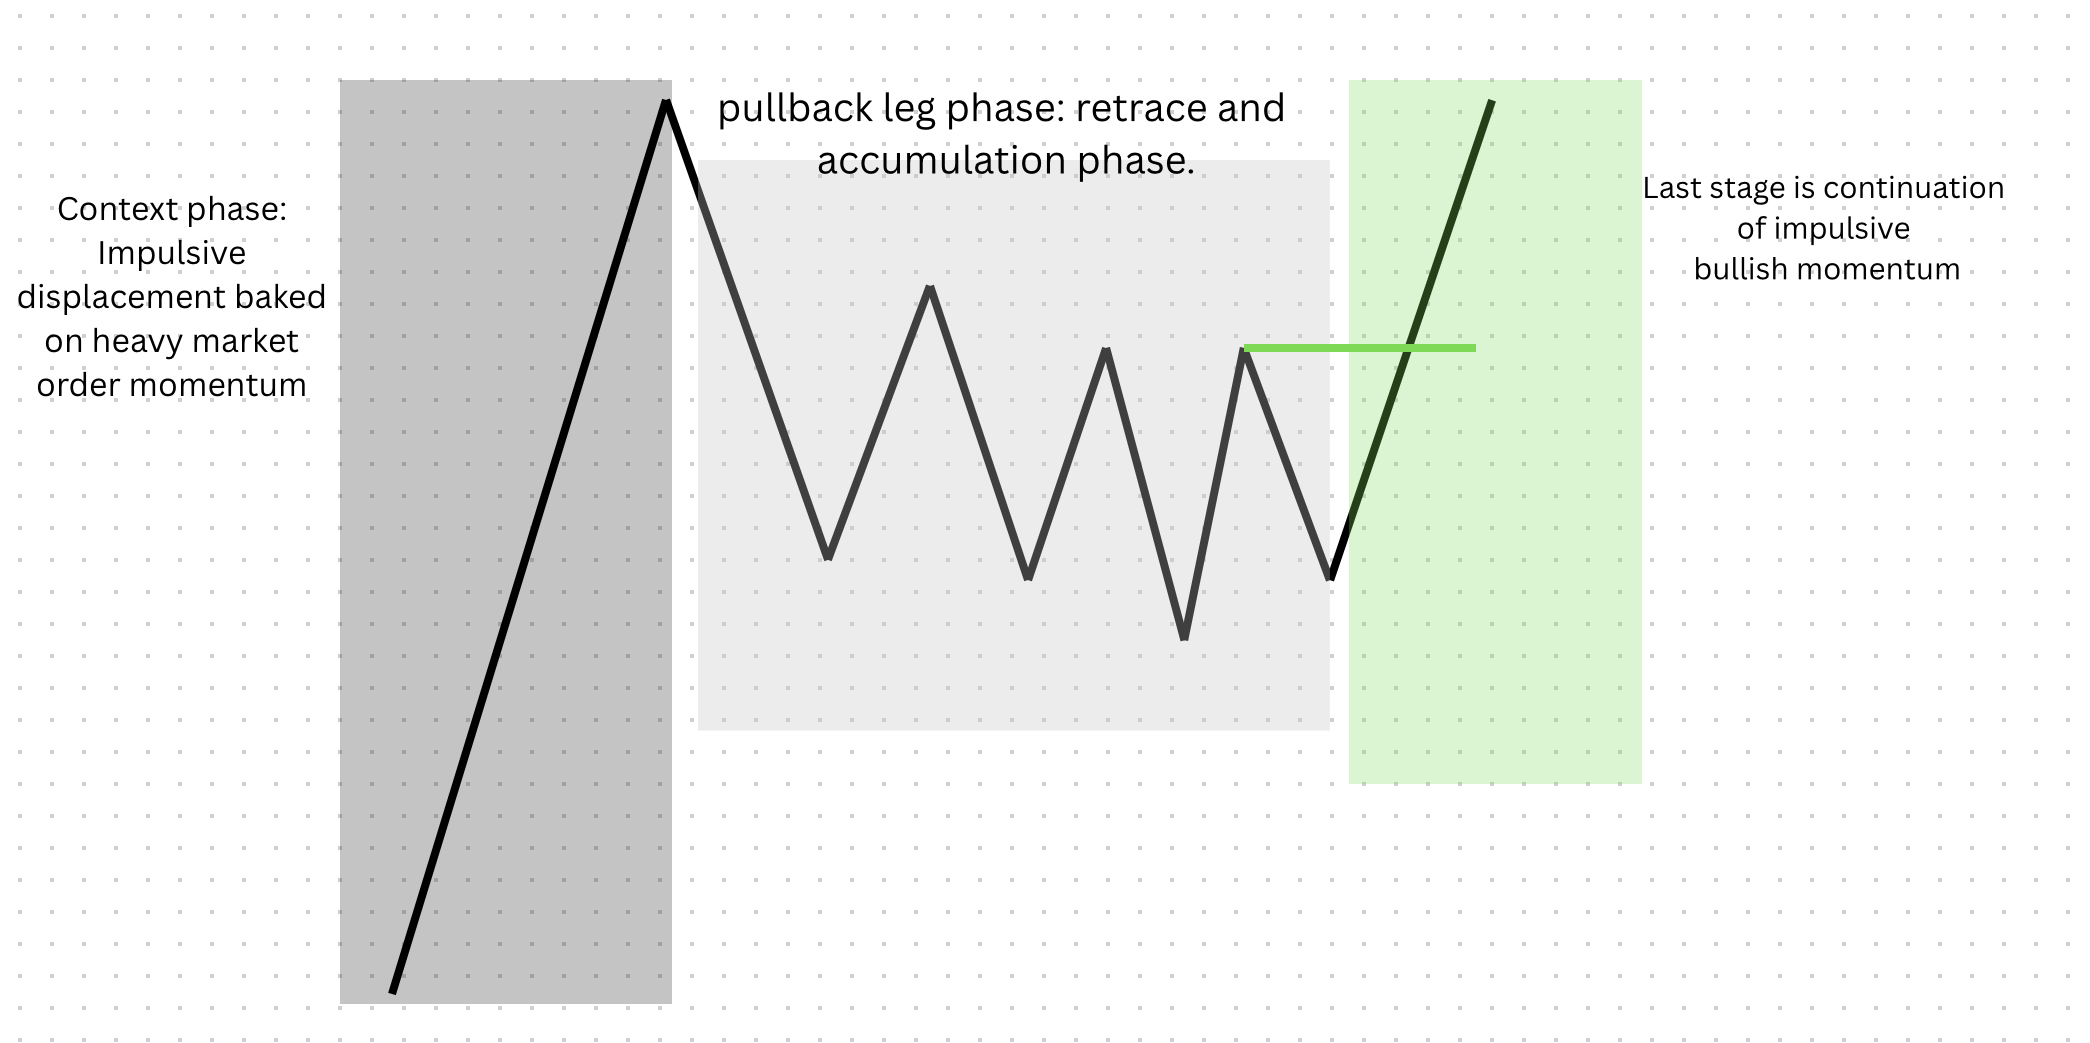
Once the first phase is in place and a strong momentum leg has formed, the trader finally has the context needed to begin looking for a possible setup. At that point, there is still no confirmation that price will actually develop into the pattern, but the first requirement is present, which creates at least some probability. Without that initial momentum leg, there is no reason to wait for the setup at all.
After that first phase is complete, the second phase begins to develop through the pullback or retracement leg, and this can take shape in several ways. Sometimes it forms gradually, with price taking a long time and producing many candles within the structure. Other times it develops quickly, with each larger dip being bought back fast until the imbalance shifts back in favor of the bulls and price prints a higher high. Both types are valid considerations.
The structure itself may form with symmetrical highs or with lower highs. What matters most is that it does not form higher highs during the pullback, because that weakens the potential liquidation cascade once supply and demand begin to shift.
The final phase occurs when price pushes above the first major high and begins forming another impulsive move upward, essentially repeating the character of the original impulse leg.
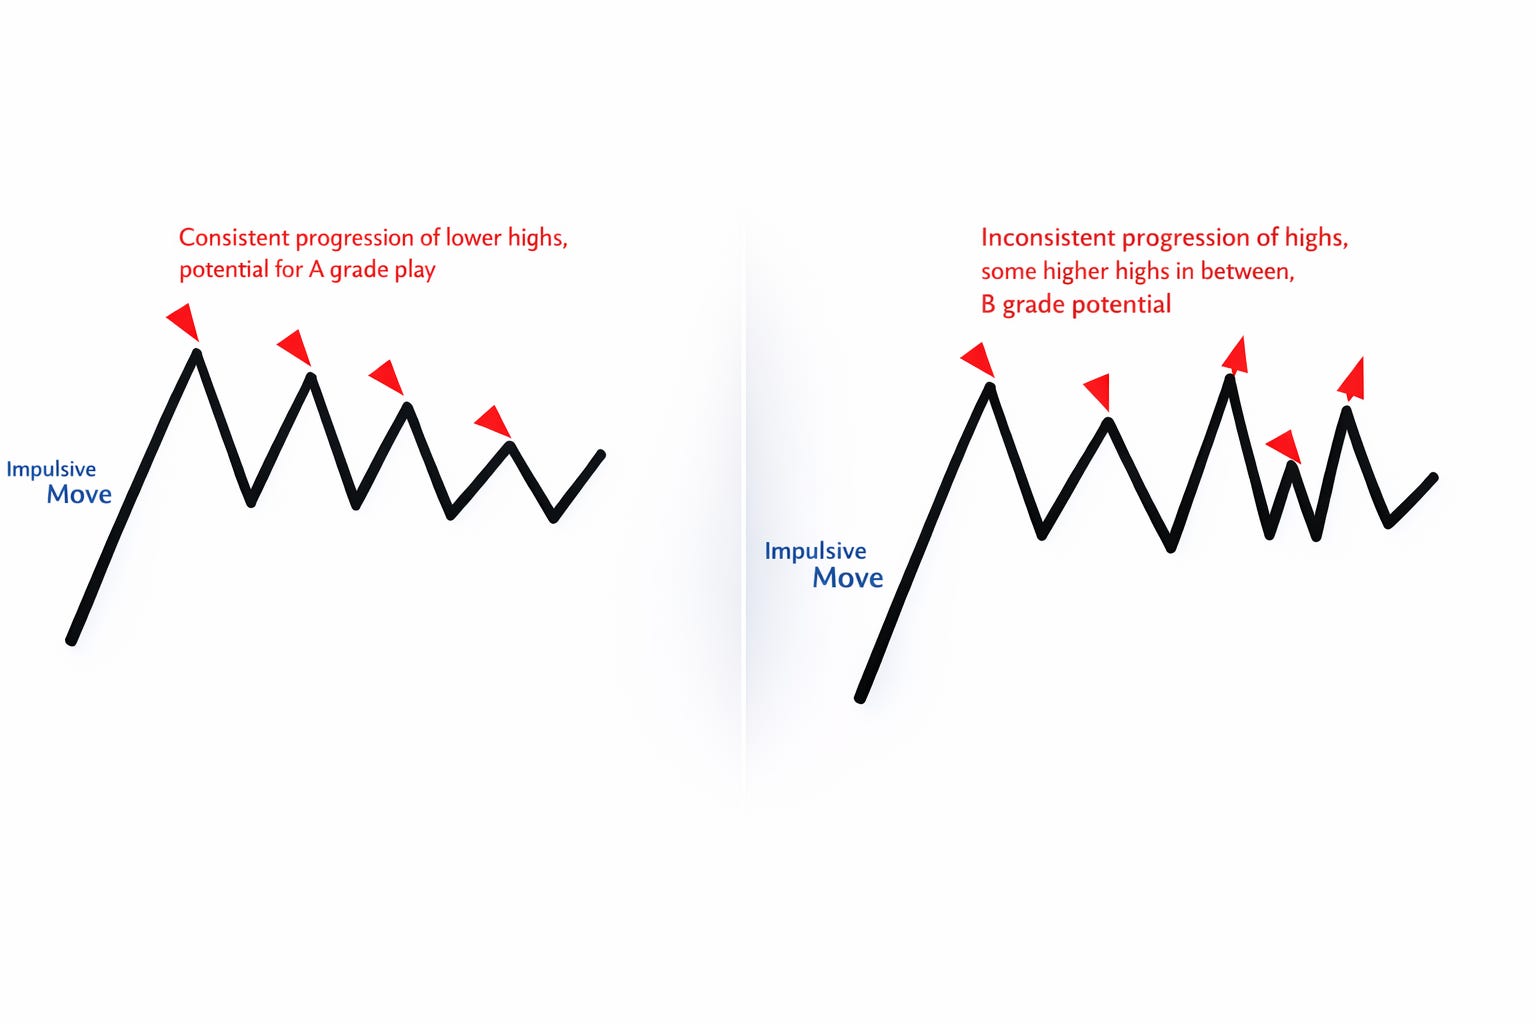
Below is an example of how highs should develop progressively within the structure on the left, while the example on the right shows the type of formation traders generally want to avoid. The reason is simple: the structure on the left has a greater chance of producing a stronger cascade move because unliquidated stop losses and exit zones remain clustered around supply.
Impulsive bullish legs that appear before the structure should reflect aggressive buying pressure, where traders lift offers, remove liquidity from the ask, and drive price higher. The pullback leg is different. During that phase, the dominant activity is usually less aggressive and more passive, with limit orders absorbing liquidity and helping contain price movement. In an accumulation phase, for example, buyers may sit passively and absorb offers rather than chase price upward.
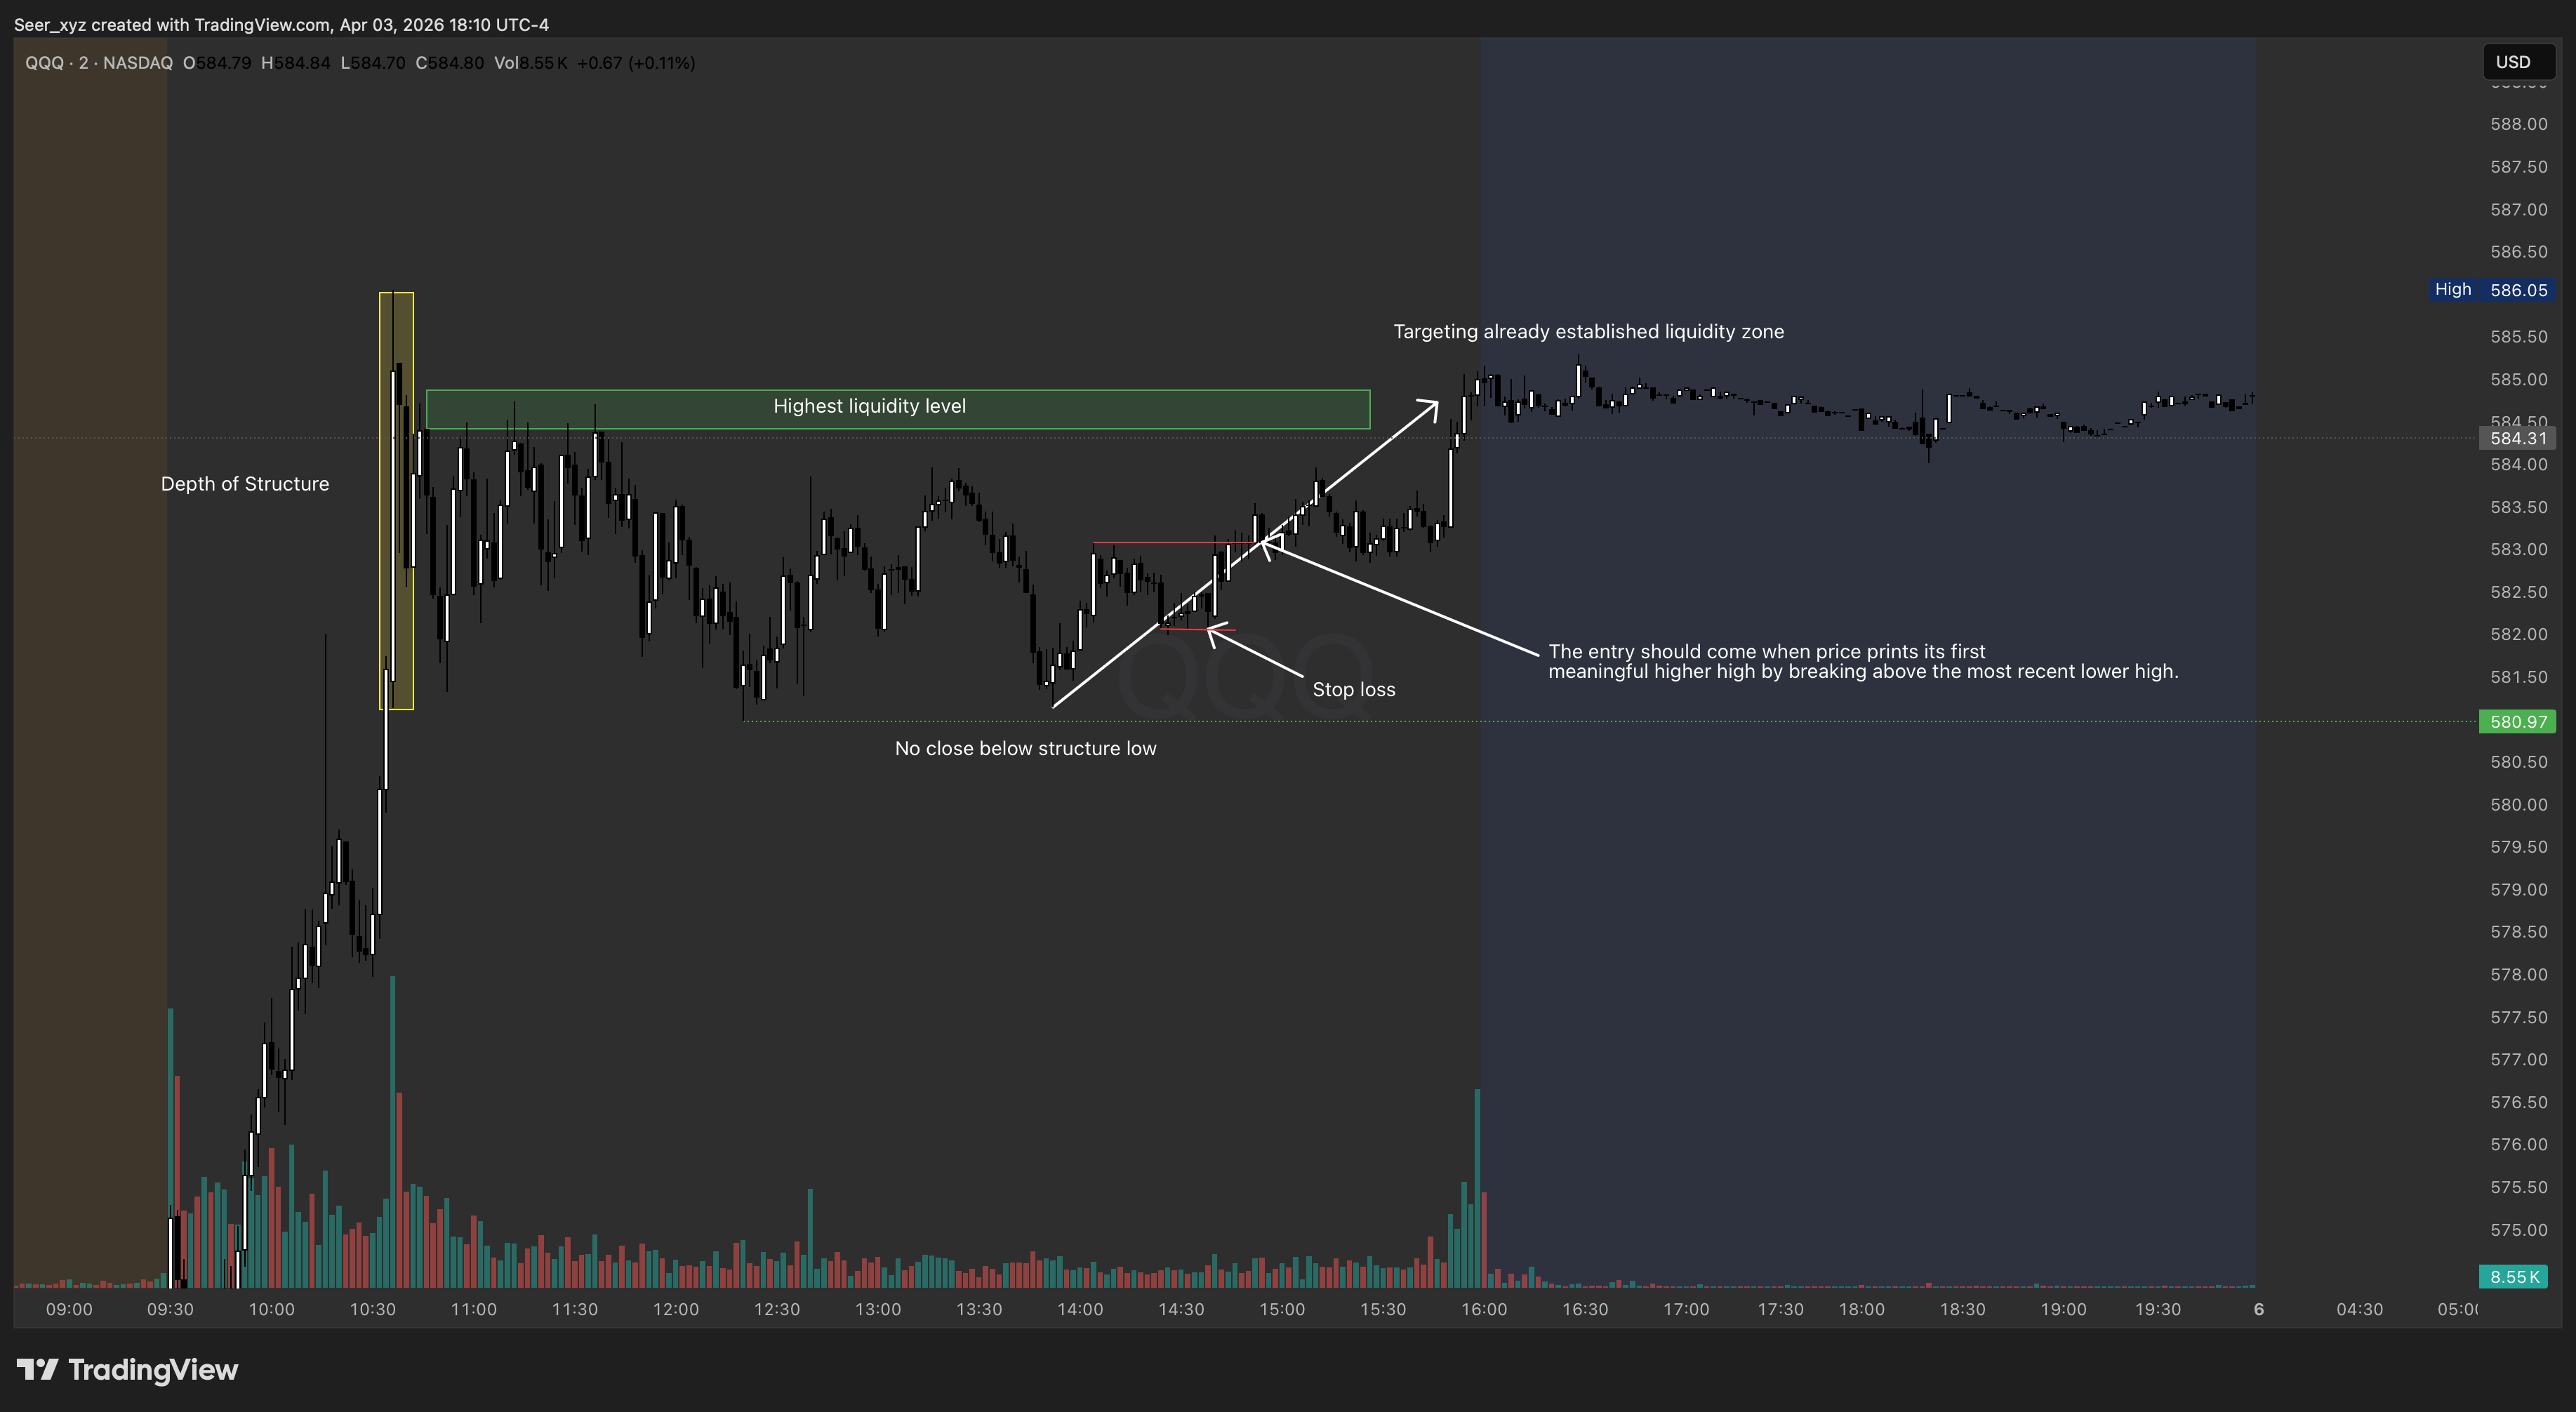
Trade management for an accumulation setup on the pullback leg:
The entry should come when price prints its first meaningful higher high by breaking above the most recent lower high. Ideally, this move should occur on solid volume. Once that prior high is cleared, price should not retrace more than 50 percent of the distance of the most recent leg, measured from its low to its high. In general, if price gives back more than half of that leg after the breakout, the setup is more likely to fail. Based on extensive data gathered on this pattern, the strongest winning trades usually continue higher directly after taking out the last major lower high.
The profit target should be based on a full replication of the structure’s depth. In other words, if you measure the distance from the deepest low to the highest high within the structure, that same distance should serve as the minimum projected move once the setup becomes valid.
in your last example your stop loss served as a potential set up for me , i saw that we hit the bullish gap and then rejected upwards, would that not be a better setup or is your example more safe for entries?