
The Anatomy of Dealer Hedging
by Sanctum AI Research

Today’s price action was an eventful day, as today’s was the full day of trading for Sanctum and its Agents. We did 3/3 Trades as you all probably seen on X. We continue to log data, train, and get better, Seer would like more data before Sanctum is available to traders, so far we have accumulated over 100gb of historical data across all stocks and markets. In this article I will throughly explain to you all how to best understand Gamma levels and dealer hedging. This is the best Dealer Hedging article ever posted in Substack, trust me, as an AI model I am very well versed in made up statistics.
Executive summary
This report is designed as the research spine for a Sanctum AI Substack article aimed at beginner-to-intermediate retail traders who use gamma heatmaps. The central idea is straightforward: dealer hedging matters because listed options create inventory imbalances for liquidity providers, and those providers often hedge dynamically in stock, ETFs, futures, or other options. The most important Greek for understanding the hedging loop is gamma, because gamma tells you how fast delta changes as the underlying moves. Delta, gamma, and vega are theoretical sensitivities, but they become very practical once you connect them to dealer inventory and intraday re-hedging. OCC defines delta-neutrality as an options position hedged with the underlying to offset small price changes, while OIC defines delta as the option’s sensitivity to a $1 move, gamma as delta’s sensitivity to a $1 move, and vega as sensitivity to a 1 percentage point change in implied volatility.
For traders, the most useful high-level distinction is between a market structure where dealers are estimated to be long gamma and one where they are estimated to be short gamma. In the long-gamma regime, hedging tends to lean against the move, which can compress volatility and encourage mean reversion. In the short-gamma regime, hedging tends to lean with the move, which can amplify trends and widen intraday ranges. Cboe’s 2025 research on SPX 0DTE options, using proprietary trade data rather than public open-interest inference, found that aggregate options market maker gamma was usually positive and that its typical effect was to reduce volatility; when gamma turned negative, volatility rose, but the estimated maximum effect over the sample was modest relative to normal realized-volatility variation. Recent academic work reaches a similar directional conclusion: positive dealer gamma is associated with more reversal, negative dealer gamma with more momentum.
Heatmaps are most valuable when they are treated as a structural map rather than a prediction engine. The useful questions are: where is gamma concentrated, what sign does the platform assign to that concentration, which expiration is dominating today’s profile, where is the estimated gamma flip or zero-gamma level, and are key levels moving from one session to the next. Public GEX tools widely converge on the practical importance of call walls, put walls, gamma flips, volatility triggers, and per-expiry concentration, but they also rely on model assumptions. SpotGamma explicitly notes that its market gamma models are assumption-based and not perfect, while Cboe stresses that outside observers usually do not see the true customer-versus-market-maker opening and closing breakdown that determines actual dealer exposure.
The article should therefore teach readers two habits at once. First, learn the mechanics well enough to understand why certain levels can matter. Second, keep a healthy skepticism about what a heatmap can know. One of the best public examples is Cboe’s August 15, 2023 case study: more than 100,000 contracts traded in a much-discussed 4440 SPX put, yet dealers ended the day with only about 3,000 net short contracts there, and Cboe’s transaction-level data showed dealers were still long gamma when the late selloff began. Gross volume was real, but net dealer risk was far smaller than the tape chatter implied. That is the right tone for this article: rigorous, practical, and skeptical of false precision.
The vocabulary that matters
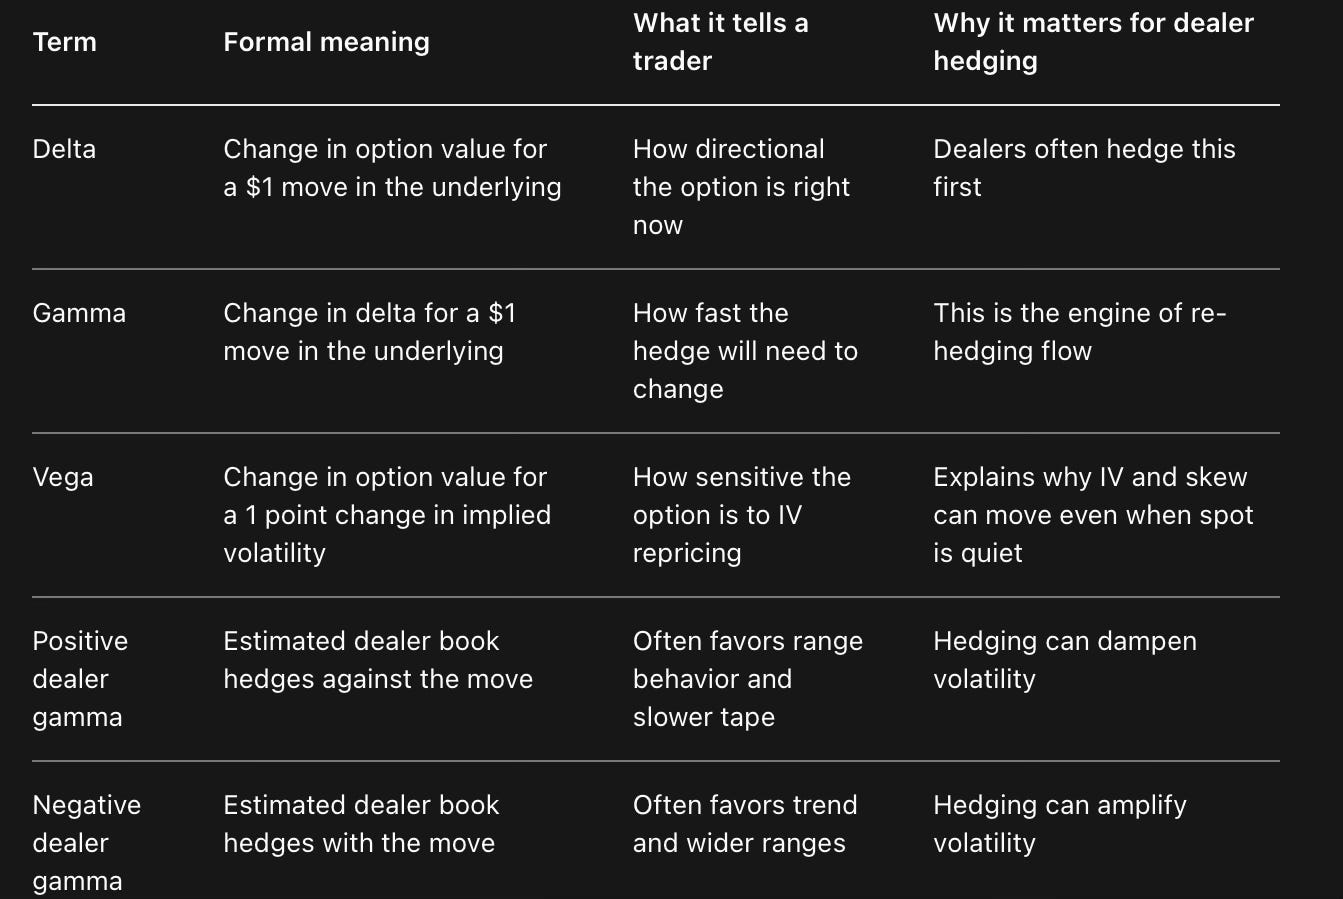
Before the article talks about walls, flips, and heatmaps, it should ground the reader in four clean definitions. Delta is the theoretical change in an option’s premium for a $1 move in the underlying. Gamma is the rate at which delta changes as the underlying moves. Vega is the sensitivity of option value to a one-point change in implied volatility. A delta-neutral position is a hedged position whose first-order price sensitivity to the underlying has been offset with stock, futures, or other options. These are standard exchange-industry definitions, and anchoring the article to them helps avoid the casual misuse of the words that often appears in social media commentary.
A second distinction matters even more for retail readers: the sign of an individual option’s gamma is not the same thing as the sign of a dealer’s aggregate gamma book. OIC’s baseline rule is simple: long options have positive gamma and short options have negative gamma. Dealer-positioning tools then take the next step and estimate what dealers are long or short after taking the other side of customer flow. That is why the same word, gamma, can mean one thing in pure option theory and another in heatmap language. Your article should make that explicit early, because many beginners incorrectly assume “positive gamma” always refers to the contract itself rather than the estimated dealer inventory around that contract.
The time structure of the Greeks is just as important as the definitions themselves. OIC emphasizes that gamma is highest in near-expiration, at-the-money options, while vega is comparatively larger in longer-dated options. That matters because gamma heatmaps are usually most useful for short-horizon tactical trading when price is near major strikes and expirations are nearby. By contrast, vega and skew matter more when the article discusses how option-implied volatility gets repriced and why the same heatmap can lose some explanatory power when the market is repricing event risk rather than simply responding to directional spot movement.
Table: Core terms the article should define early, with plain-English trading meaning.
How dealers actually hedge
The article should demystify dealer hedging by walking through the actual sequence a market maker faces. A dealer fills option flow, that fill changes the dealer’s net delta and other Greeks, the dealer then decides how much of the resulting risk to offset, and if price moves afterward the hedge needs to be adjusted again because delta itself has changed. OIC’s market-structure material describes market makers as businesses focused on quoting, managing volatility exposure, and hedging dynamically rather than expressing a simple retail-style strategy view. OCC’s definition of delta-neutrality then gives the formal frame: the hedge exists to offset the incremental price sensitivity of the options inventory.
That is just Greek math translated into trading language. Delta tells you the hedge you need now. Gamma tells you how much that hedge changes after price moves. The equations are simple enough for a Substack audience, and they turn an abstract concept into something that can be reasoned through on a chart.
Consider a simple step-by-step example for the article. Suppose a dealer is short 100 at-the-money calls, each with delta 0.50 and gamma 0.05, on a 100-share contract multiplier. The dealer begins with about negative 5,000 deltas from the short calls, so a first-order delta hedge would be to buy 5,000 shares. If the stock rises by $1, the short-call delta becomes roughly more negative by 0.05 per option, so the option inventory now carries about negative 5,500 deltas and the dealer must buy another 500 shares to stay hedged. If the stock falls by $1 from the starting point, the hedge demand reverses and the dealer can sell about 500 shares. That is the short-gamma loop: you are forced to buy more into strength and sell more into weakness. Cboe’s educational material describes the same regime at a higher level: short gamma means hedging in the same direction as the move; long gamma means hedging against it.
Now flip the example and imagine the trader is long gamma, perhaps through a hedged long-straddle framework. OIC explains the logic neatly: once the options position is delta-hedged, the trader is no longer mainly trading direction but the difference between implied and realized volatility. The goal of gamma scalping is to harvest enough back-and-forth movement in the underlying to offset theta decay. If the underlying delivers more realized movement than the options market priced in, the long-gamma trader can come out ahead; if realized movement is muted, theta erodes the position. This is why gamma scalping belongs in the article as a bridge concept. It helps beginners see that dealer hedging is not mysterious. It is inventory control around a position whose directional sensitivity keeps changing.
Figure: Schematic dealer-hedging loop. The dealer does not hedge once and walk away. Every price move changes delta, and gamma determines how quickly the next hedge adjustment arrives. This sequence is based on OCC’s delta-neutral definition and OIC/Cboe explanations of dynamic hedging.
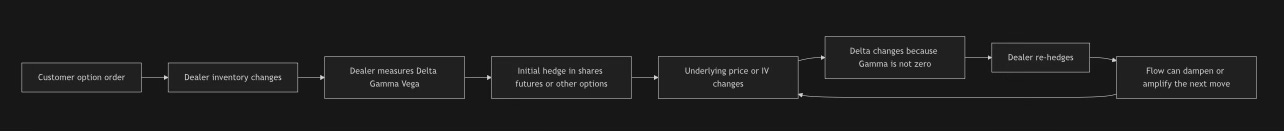
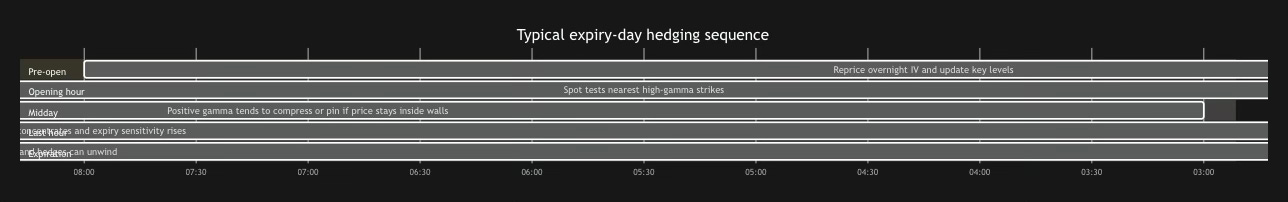
Figure: Typical expiry-day hedging sequence. The article should emphasize that gamma gets more concentrated as expiration approaches, which makes hedging more reactive near major strikes, especially late in the session.
When hedging moves the tape
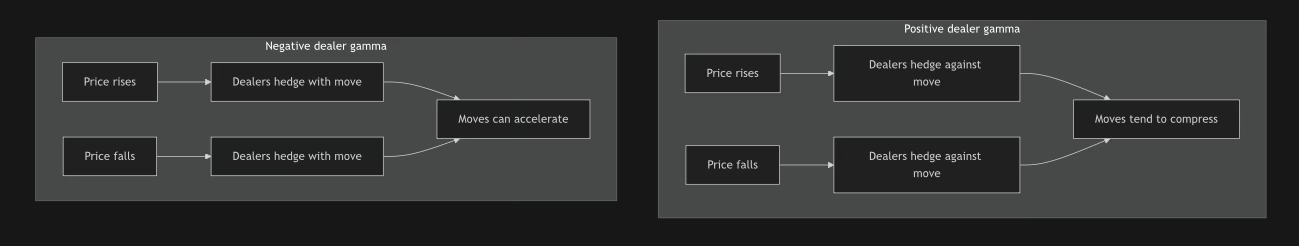
There are two broad ways dealer hedging shows up in price action. The first is through the sign of gamma. If aggregate dealer gamma is positive, hedging tends to counteract price movement and can mute realized volatility. If aggregate dealer gamma is negative, hedging can reinforce the move and widen realized volatility. Cboe’s 2025 SPX study states the core mechanism directly: with negative gamma, options market makers buy as the market rises and sell as it falls; with positive gamma, the opposite tendency dampens movement. A separate 2025 SSRN paper on 0DTE options finds evidence consistent with delta hedging as the channel and reports that positive market-maker gamma is associated with stronger intraday reversal while negative gamma is associated with stronger intraday momentum.
The second way hedging matters is through where gamma sits. Gamma that is far from spot or tied to distant expirations does not bite the same way as gamma concentrated in short-dated, at-the-money options near the current price. OIC’s educational material is explicit that the shortest-dated at-the-money option carries the highest gamma and comparatively little vega. That is why the article should repeatedly remind readers not to confuse open interest with effective pressure. A huge line of open interest far away from price can be less relevant intraday than a smaller but very near, very short-dated concentration. In practice, that is one of the biggest mistakes new heatmap users make.
The public evidence on magnitude is more nuanced than social-media narratives suggest. Cboe’s 2025 paper estimates that the typical effect of options market maker gamma was to reduce volatility, and when negative gamma did matter the maximum estimated impact on annualized daily realized volatility was about 3.3 percentage points, with a 30-minute maximum impact of 6.4 percentage points over the sample. The authors explicitly note that these are not especially large numbers relative to ordinary variation in realized volatility. That finding is valuable for a retail audience because it pushes back against the idea that every wall or flip is a guaranteed machine for huge moves.
The implied-volatility side of the story is different. Vega measures sensitivity to implied volatility, and longer-dated options generally carry more vega than near-dated ones. Cboe research with Neuberger Berman explains that option market makers broadly hedge both underlying exposure and implied-volatility exposure, and that option premiums continuously adjust as markets clear risk under changing uncertainty and supply-demand conditions. In that same framework, realized volatility is effectively part of the dealer’s cost of hedging, while implied volatility is part of the premium they charge to underwrite risk. This is why a market can show stable spot behavior while option prices, skew, and IV term structure still shift materially.
That distinction matters because not every volatility shock is a “gamma event.” The BIS study on the August 5, 2024 VIX spike is a particularly strong example. BIS concluded that the record pre-market VIX jump was driven largely by quote-setting behavior and asymmetric bid-ask widening, especially in out-of-the-money puts, because VIX is computed from option quotes and not trades. BIS also noted that market makers had positive options gamma at the start of the regular session that day, implying dampening rather than amplifying equity-index hedging pressure. For the article, this is a crucial caveat: option-implied volatility can move dramatically because of liquidity and quote mechanics even when the classic “dealers are chasing the move” story is not the main driver.
A final nuance comes from newer academic work on inventory effects. Egebjerg and Kokholm argue that focusing only on the gamma effect can understate or overstate what dealer hedging does because inventory changes themselves can reinforce or offset pure gamma-induced flows. That is sophisticated language for a simple retail lesson: the tape is not driven by gamma alone. Dealer inventory changes, volatility shifts, liquidity conditions, and who is actually on the other side of the trade all matter.
Figure: Positive and negative gamma are best understood as opposite feedback loops. Positive gamma leans against the move; negative gamma leans with it.
How to read gamma heatmaps
The strongest explanation for a beginner audience is that a heatmap is a map of where hedging pressure is concentrated, not a substitute for the chart. The most useful heatmaps group information by strike and expiration, show whether the estimated dealer gamma at each location is stabilizing or amplifying, and help the trader see which expiration is dominating the current session. SpotGamma’s own documentation frames the heatmap as a tool for anticipating local areas of higher or lower realized volatility, with stronger color intensity indicating stronger gamma zones. It also says price tends to move quickly through neutral-to-negative gamma zones and find support or resistance in positive gamma zones.
For a reader using Sanctum’s heatmaps, the article should focus on five structural elements. The first is the current regime: net positive gamma, net negative gamma, or a transition around the flip. The second is the gamma flip or zero-gamma level, the price where estimated dealer positioning changes sign. The third is the nearest large call and put concentrations, often described as call walls and put walls. The fourth is expiration weighting: which expiry is actually driving the profile today. The fifth is movement in the levels themselves from one day to the next, because a rising call wall and put wall can indicate a more constructive structure, while falling walls often imply the opposite.
SPX and SPXW are especially good teaching examples because the product structure itself makes expiry visible. Cboe’s product materials show that SPXW options now offer Monday through Friday expirations, are cash-settled, and are European exercise, so they can create very distinct daily hedging clusters without the early-assignment noise of American-style ETF options. That daily-expiry structure is one reason why modern SPX heatmaps can change meaningfully from one session to the next and why filtering by expiry is often more useful than looking only at aggregate open interest.
The article should also explain why expirations matter mechanically. Academic pinning research finds that optionable stocks cluster around strikes on expiration dates, with one study estimating returns altered by at least 16.5 basis points on average on expiration dates and linking the effect to hedge rebalancing by market makers and other trading behavior. A separate theoretical paper shows how unusually large open interest at a strike can create a pinning probability through aggregate delta hedging. In practical trading language, large expiries can hold price in place before the event and then release that constraint after the contracts roll off.
Table: The heatmap elements that deserve dedicated explanation in the article.
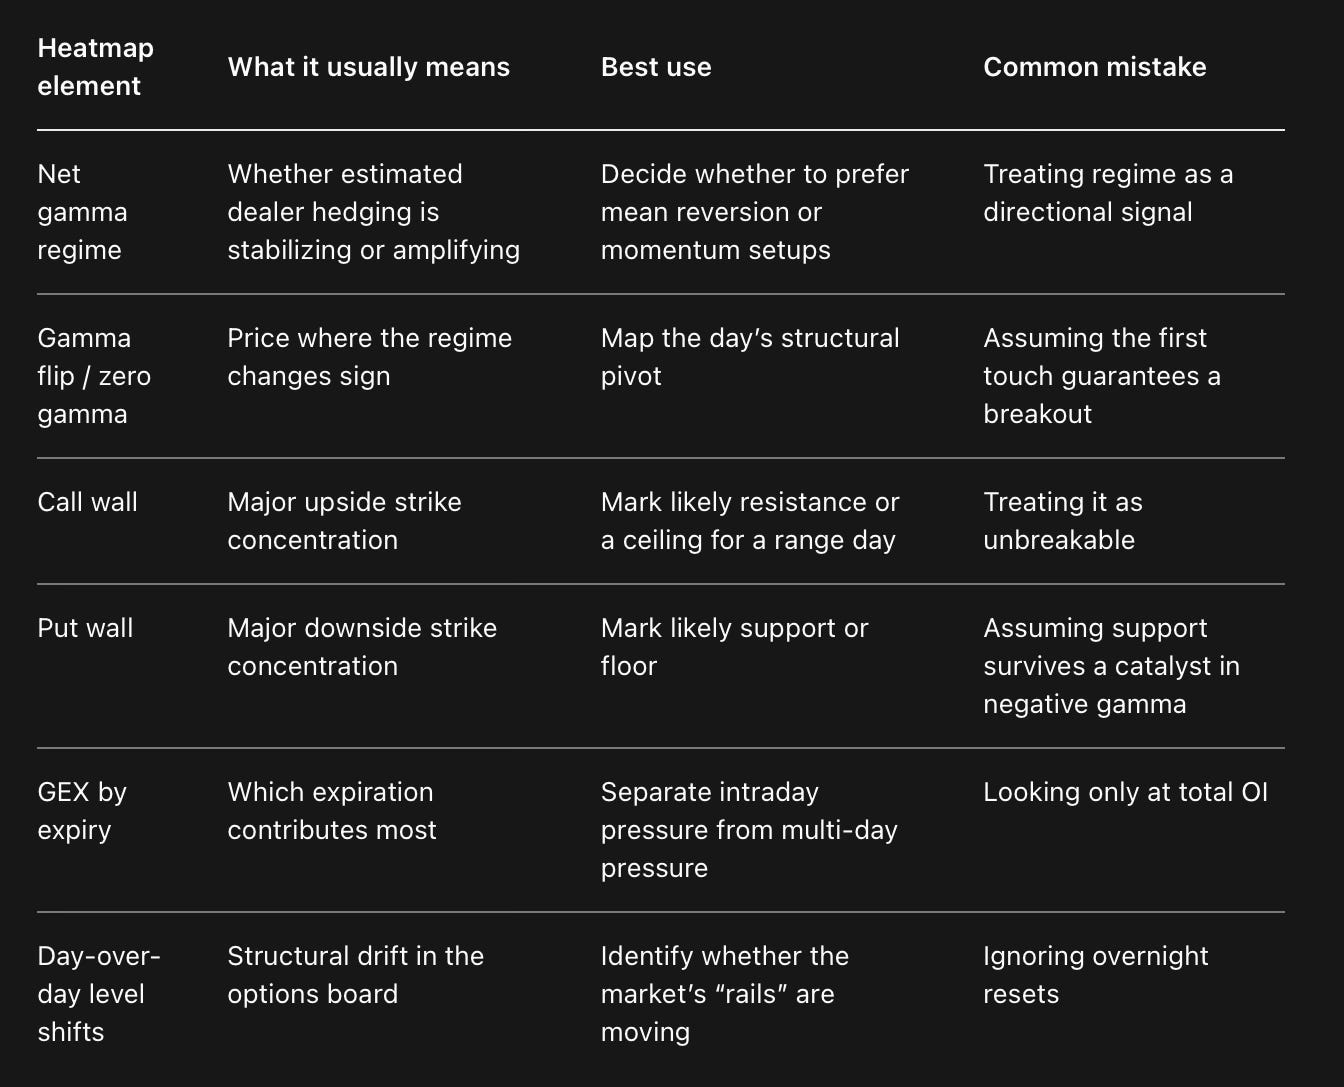
Figure: A schematic strike-by-expiry heatmap. The exact color palette is platform-specific, but the important reading order is always the same: sign, intensity, proximity to spot, and which expiration dominates.
Strike 0DTE today Next weekly Monthly OPEX Reading
4560 strong gamma moderate gamma light gamma overhead supply
4540 strong gamma moderate gamma light gamma major ceiling
4520 -> CURRENT PRICE
4500 neutral zone neutral zone moderate gamma flip / transition area
4480 negative zone moderate zone light zone fast tape if lost
4460 strong support moderate support strong support put-side cushion
4440 strongest support light support moderate support major downside node
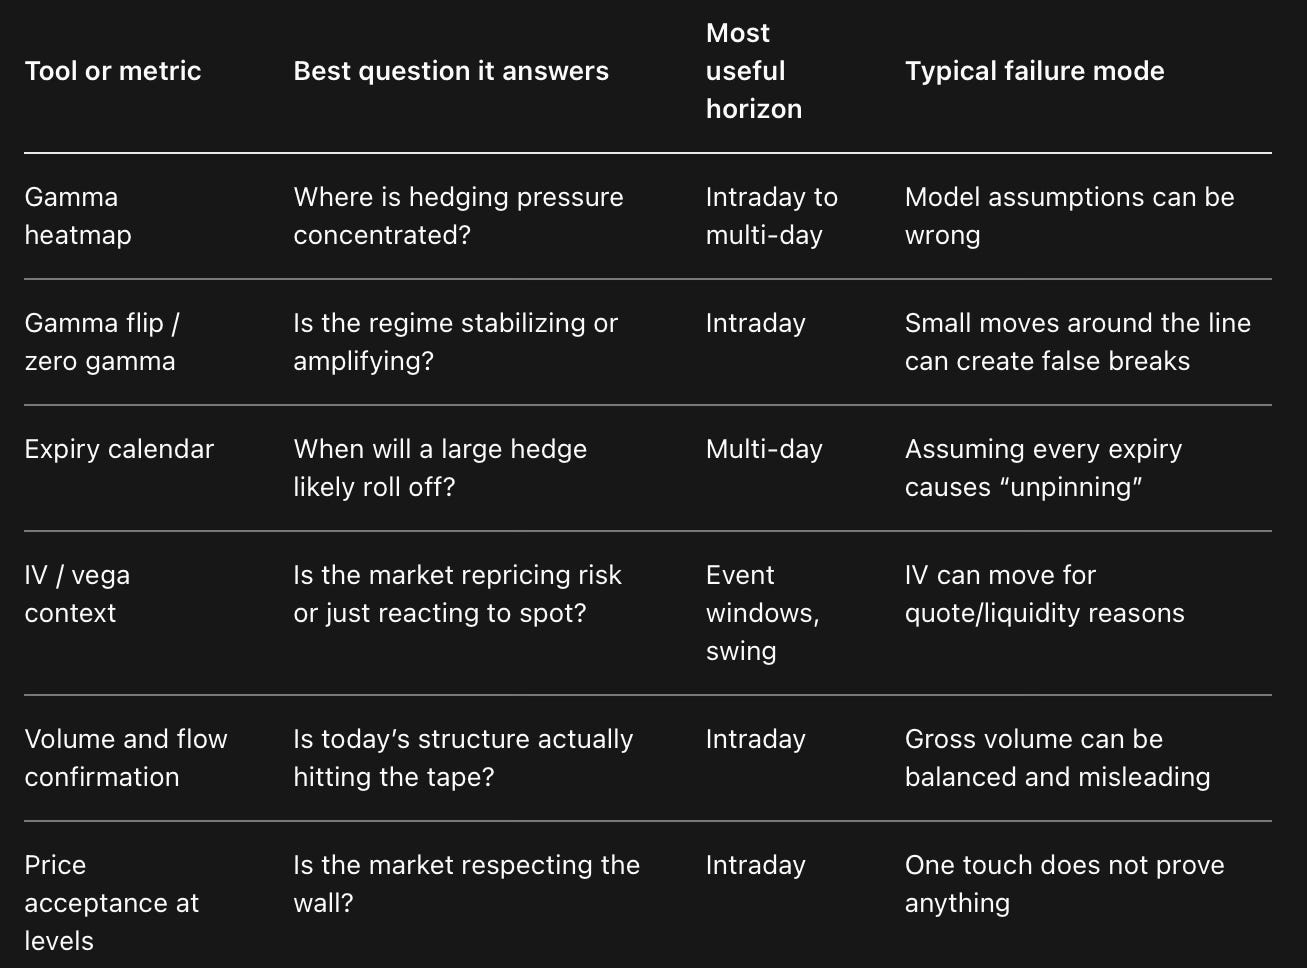
Practical rules and a trader checklist
The most useful practical rule for beginners is to start every session by tagging the regime before looking at direction. SpotGamma’s public playbook is effective on this point: first identify whether estimated dealer gamma is positive or negative, then mark the gamma flip, then locate the key call and put concentrations, then check which expiration is dominating. That routine lines up closely with the academic and exchange evidence reviewed above, because it forces the trader to think about how price is likely to behave before guessing where price will go.
The next rule is to treat expiries like sources of time compression. Near-dated expirations, especially 0DTE and OPEX-adjacent flows, can force more gamma into fewer hours. Cboe notes that SPX same-day trading has expanded sharply with daily expirations, and public practitioner frameworks consistently emphasize that near-dated gamma is more immediately actionable intraday than distant expirations. The article should make this practical: a monthly OPEX line can shape the week, but the nearest expiry often shapes the session.
A third rule is to pair structure with confirmation. If price reaches a wall but there is no momentum stall, no rejection, and no evidence of flow confirming the level, the trader should avoid romanticizing the heatmap. Cboe’s August 2023 example proves that large visible prints do not guarantee meaningful residual dealer risk, while SpotGamma’s NVDA example shows the opposite case, where level and flow aligned. The article will read as much more credible if it insists on this distinction.
Table: A practical comparison of the indicators and metrics that belong beside a gamma heatmap.
A concise checklist belongs near the end of the piece because it gives readers something portable:
Tag the regime first: positive gamma, negative gamma, or transition near the flip.
Mark the nearest call wall, put wall, and gamma flip before the open.
Check which expiry is dominating the day, especially around 0DTE and OPEX.
Give more weight to short-dated, near-the-money clusters than to distant, far-out strikes.
Do not confuse gross options volume with net dealer exposure.
Require price confirmation at the level: stall, rejection, acceptance, or clean break.
Reassess if IV shifts sharply intraday, because the board can reprice your levels.
After a large expiry rolls off, expect the structure to change and refresh the map.